1. Approximately 40% of the Russell 2000 Index constituents lost money over the last 12 months, indicating that the index has a lower quality complexion than large-cap indices and that many constituents require ongoing financing. The higher percentage of loss-making companies likely indicates that companies have been harder hit by rising financing costs, which should be alleviated partially when the Federal Reserve (the Fed) shifts to rate cutting. I still believe investors, however, will be well served by having a quality bias in the small-cap opportunity set, given that I expect the fed funds rate to decline to the 3-4% range in this easing cycle.(1)
Interestingly, close to 25% of non-earning companies in the Russell 2000 Index are biotechnology (biotech) companies(2), and nearly 90% of the biotech stocks in the Russell 2000 Index have historically lost money. Many active managers who have eschewed biotech have often found their relative performance whipsawed by swings in the biotech sector from euphoria to despair. Within small caps, a manager’s approach to engaging biotech stocks can be critical to the volatility of excess returns.
2. Companies in the Russell 2000 Index have been more leveraged than their S&P 500 Index peers, which means rising rates were more punitive to earnings and share prices.

All data is as of September 2023 (last 12 months). Aggregated based on FactSet data.
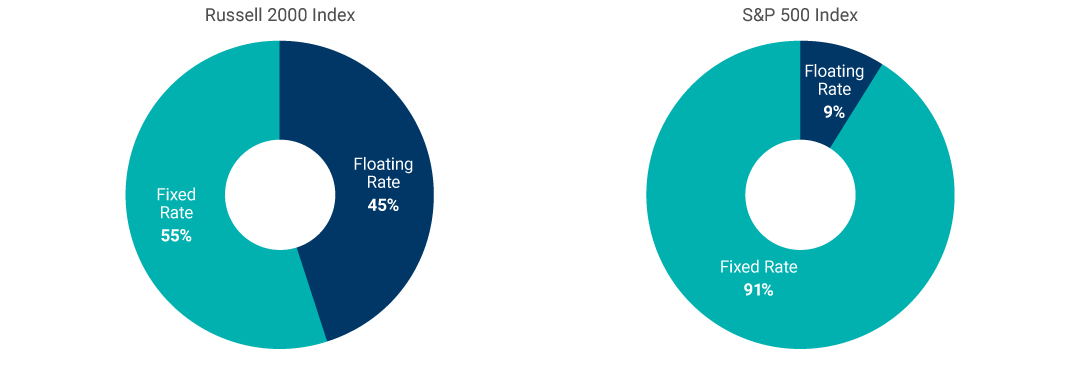
3. Small-cap companies have more floating-rate debt, with 45% of aggregated Russell 2000 Index debt (excluding financials) classified as floating rate compared to only 9% of the S&P 500 Index debt. Given this floating exposure, if the Fed transitions to cutting short-term rates, small-cap stocks should likely benefit more than large caps.
Floating Rate Debt Could Benefit Small Caps More Than Large Caps

As of 30 September 2023
Source: Bloomberg, Goldman Sachs Global Investment Research
To the extent that we are experiencing a bubble in the cap-weighted S&P 500 Index, we could be setting up for a period of prolonged, and substantial, outperformance from small caps. For example, if we look back to the end of 1999, near the peak of the telecommunications, media, technology (TMT) bubble, we can see that over the subsequent eight years (12/31/99–12/31/07), the Russell 2000 Index delivered a total return of 69%, the S&P 500 Equal Weighted Index delivered 66%, and the S&P 500 Index (cap-weighted) delivered 15% (total return). The annualized total return from small caps through that eight-year period was 676 basis points (bps), while the S&P 500 Equal Weighted Index delivered an excess return of 652 bps and the S&P 500 Index (cap-weighted) only 175 bps.
I am not suggesting there is a bubble in the U.S. cap-weighted index; however, I do think this historical comparison could be useful for investors as they allocate capital going forward.
Russell 2000 Index constituents generate about 90% of their revenue in the United States versus around 60%–65% of the S&P 500 Index revenue. In our view, the domestic orientation of these companies should be a positive given the expected relative resilience of U.S. growth in 2024 and beyond.
While I personally do not subscribe to the idea of wide-scale reshoring of production to the United States (as opposed to reconfigurations of offshore production to be closer to the United States and/or domiciled in countries that are allied with the United States), I see a greater desire among companies to ensure that supply chains are more resilient and closer to the customer, which should benefit domestic producers on the margin.
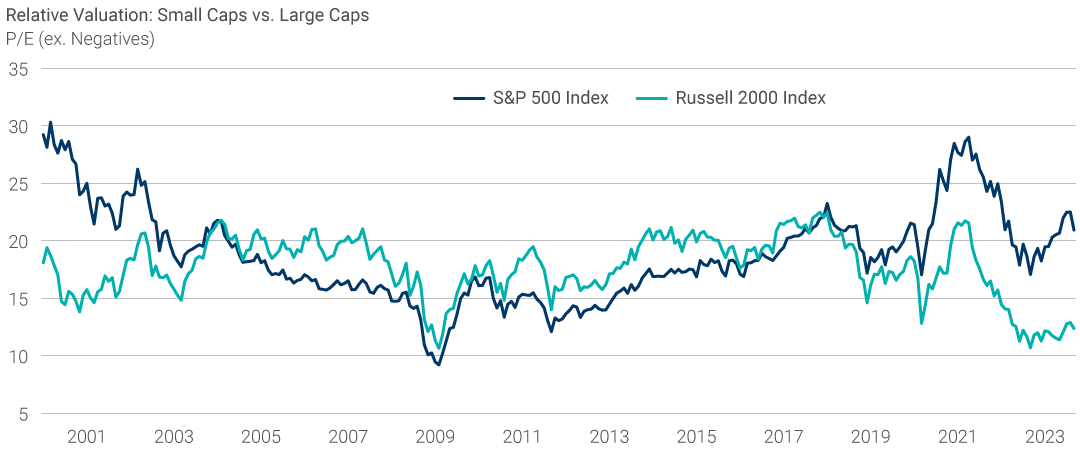
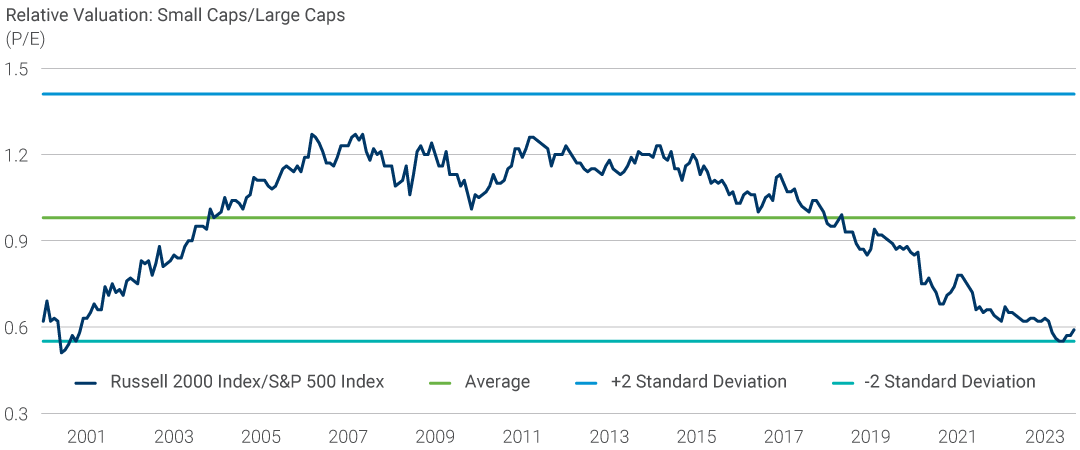
Lastly, the valuation differential between small- and large-cap stocks has reached extreme levels. Since 2000, the trailing 12-month P/E ratio for positive earners in the Russell 2000 Index has averaged 98% of the comparable multiple for the S&P 500 Index. The lowest relative valuation was in June 2000 when the Russell 2000 P/E ratio was at 51% of the S&P 500 Index. As of 30 September 2023, the ratio stood at 59% after reaching 55% in May and June of 2023. Considering the factors noted above and relative valuation, we believe the opportunity in U.S. small-cap investing appears compelling.
Small Caps Trading at a Nearly Two Standard Deviation Discount to Large Caps


Based on data from January 2000 through September 2023
For illustrative purposes only.
Source: Lazard, FactSet
(1) Source: Bloomberg; As of 17 November 2023
(2) Bank of America Merrill Lynch


